Non-Domestic Rates: Arrears and Provisions – A Sector Perspective
Over the weekend, I reviewed the accounting estimates sections of the 2024–25 NNDR3 returns. While admittedly a niche activity, a better understanding of the picture presented could be helpful to Billing authorities facing January estimates.
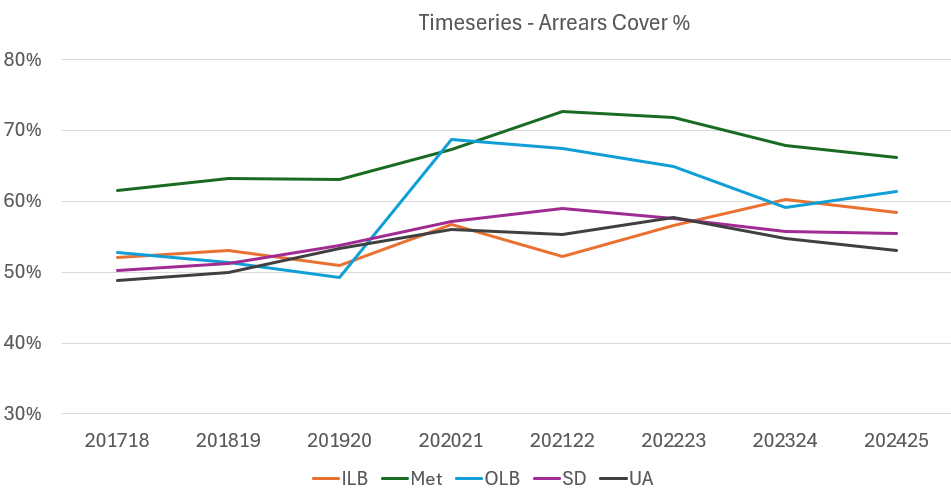
To show the national picture, this graph provides a time series comparison across local authority sectors. It illustrates the proportion of outstanding debt that has been provisioned since 2017–18. This article explores the factors driving these trends.
Current Arrears and Provisions
NNDR3 data as at 31 March 2025 reveals notable disparities in current cover ratios across local authority types:
- Metropolitan authorities lead with a 66% provision rate.
- Unitary authorities average just over 50%.
These differences will reflect a complex mix of factors, but for the purposes of this article, I’ll focus on two:
- The response to pandemic-era arrears
- Local choices around provision levels and risk appetite
The Pandemic Legacy
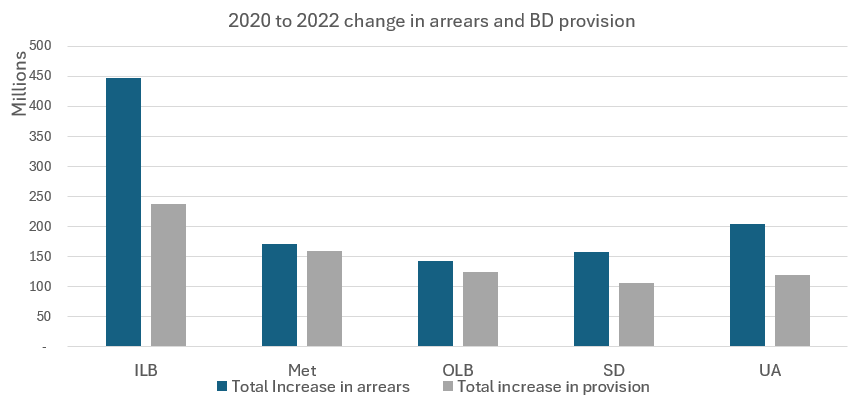
Between 2020 and 2022:
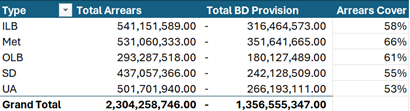
- Business Rates arrears increased by £1.1 billion
- Provisions against non-payment rose by £750 million
Outer London Boroughs and Metropolitan authorities appear to have provisioned for nearly all additional arrears during this period. In contrast, Unitary Authorities and Inner London Boroughs have provisioned for roughly half.
Although provisions have declined slightly over the past two years, they remain £500 million above March 2020 levels. During the same period, arrears have fallen by about 10%, yet still hover near the post-pandemic peak of £2.3 billion.
In short, sectoral differences in pandemic-related arrears continue to shape the current landscape.
Local Variation and Risk Appetite
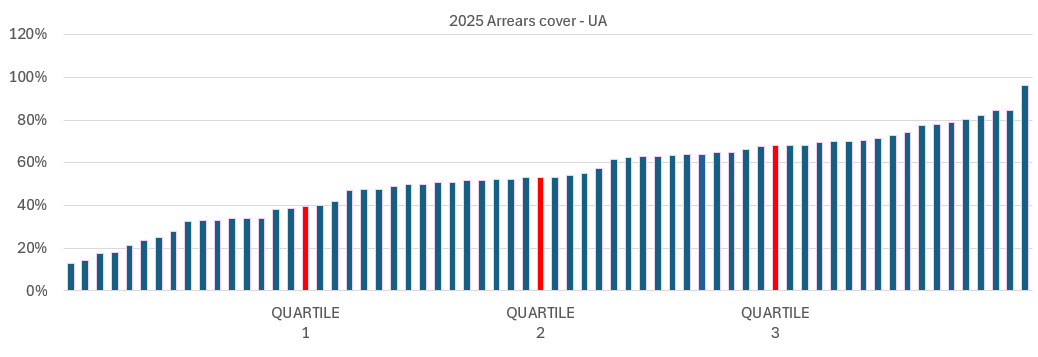
Even within individual sectors, the picture is far from consistent. Among Unitary Authorities, arrears coverage ranges from under 20% to over 90%. The gap between the highest and lowest provision levels is striking, highlighting the importance for authorities to understand their position relative to the wider sector.
Summary
The latest NNDR3 data highlights how pandemic-era arrears and local provisioning decisions continue to shape the business rates landscape. Arrears remain close to peak levels, while provision ratios vary significantly both between and within authority types—making it essential to understand your position.
As the sector approaches the 2026–27 reset, setting the right level of provision is critical: prudent enough to guard against future non-payment, yet not so cautious that it unnecessarily restricts resources today.